
NOTICE: I stopped updating this page in late May, 2020. For some excellent Coronavirus links, scroll to the bottom of the page.
From wikipedia: “Severe acute respiratory syndrome coronavirus 2 (SARS-CoV-2) is the strain of coronavirus that causes coronavirus disease 2019 (COVID-19), a respiratory illness. Colloquially known as the coronavirus, it was previously referred to by its provisional name, 2019 novel coronavirus (2019-nCoV).”
According to the World Health Organization (WHO), “coronaviruses are a large family of viruses that cause illness ranging from the common cold to more severe diseases such as MERS and SARS.” As of May 26, 2020, the first case identified in a human is thought to have occurred as early as October 2019 in China. The first official case identified in the United States was in Illinois in January 2020. The confirmed case count in the US exploded over time:
1. By March 1st: 75
2. By April 1st: 220,000
3. By May 1st: 1,130,000
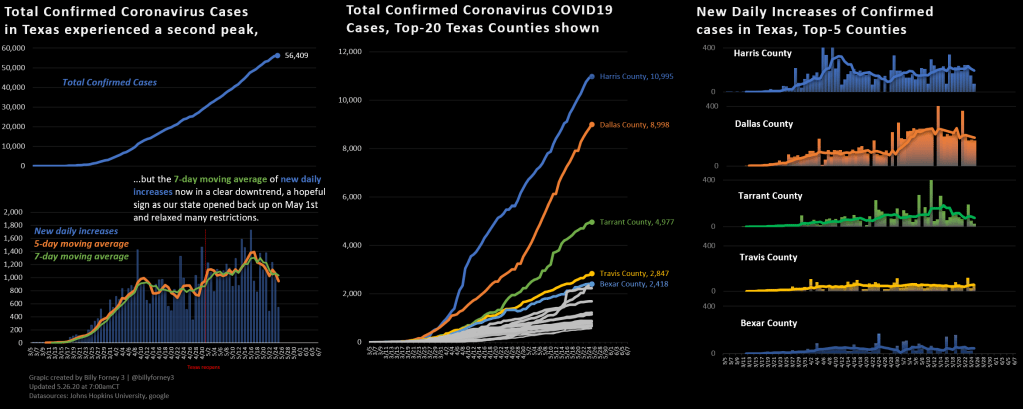
I have created the charts on this webpage using daily values reported by Johns Hopkins University. There are a ton of great sources of data visualizations surrounding this pandemic (see bottom page for my favorite list). Why did I create this page? Put simply, I enjoy creating graphics for better data visualizations. I am NOT an epidemiologist, virologist, health care professional, etc. There are some great ones out there to follow, especially on Twitter. But, the charts I display here are for informational purposes only and should not be used as a basis for any public or pirvate healthcare decisions. For official coronavirus information, please follow your local, state, and government healthcare agencies.
Additional information:
- Confirmed Cases: the Centers for Disease Control & Prevention (CDC) has a few classifications for those with the disease or suspected of carrying. First, there are persons under investigation (PUIs). These are people who have not yet been tested for COVID19 but are suspected of having it. Next, there are presumptive positive cases. And finally, there are confirmed positive cases. The headline number shown in media is typically confirmed cases.
- Recovered Cases: recovery numbers, when displayed here, are only estimates based on assumptions about hospitalizations and recovery times, and they can change as more information becomes available. People are indeed recovering from this virus. But, without the ability to accurately retest the entire population for the virus or the virus’ antibodies, the only way to get a true recovery number would be to follow up with all the patients to see how they’re doing. That would require significant resources that are being directed toward contact tracing, health experts say.


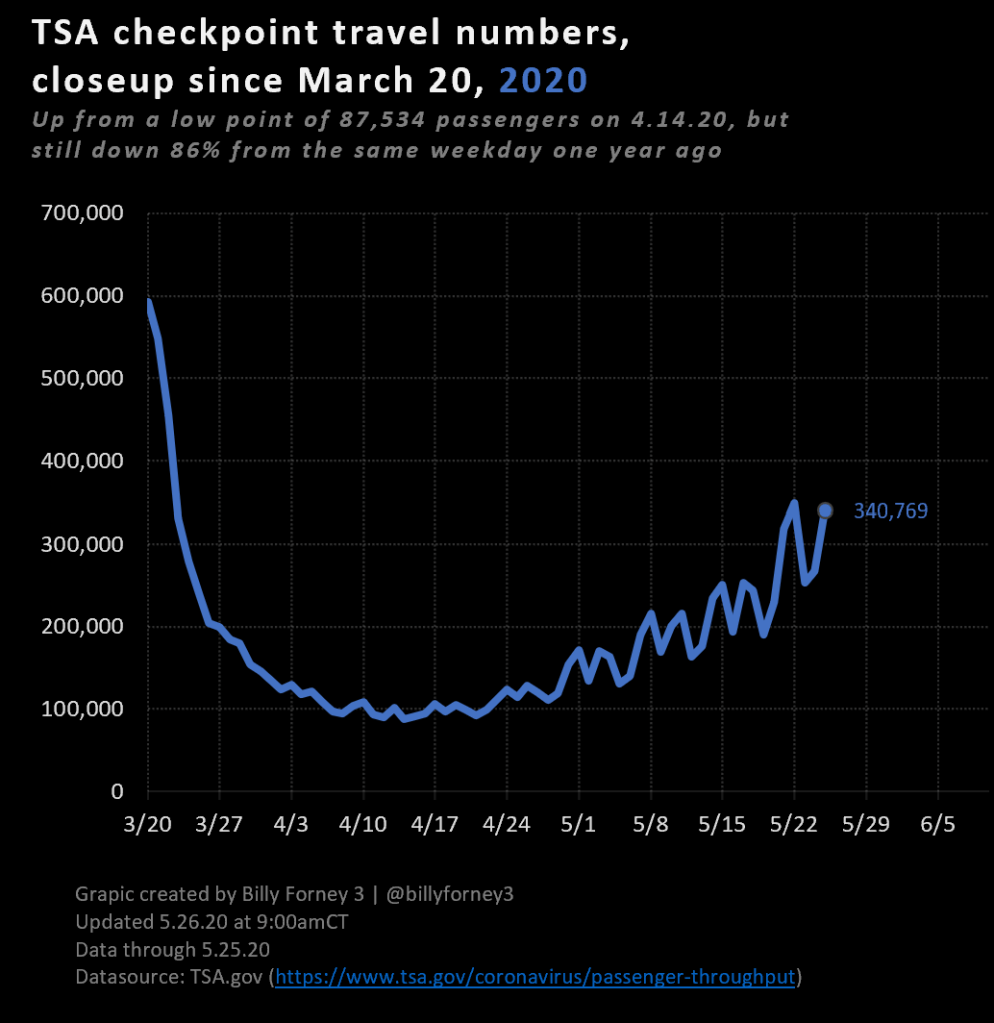
How is the country recovering after states have begun opening back up from lockdowns? Here are a couple of metrics that may provide early indicators on the health of the recovery.

Coronavirus resources I follow:
. Johns Hopkins University
. 1Point3Acres
. Centers for Disease Control & Prevention
. World Health Organization
. Worldometers
. Information is Beautiful
. Our World In Data
. Testing via Covid Tracking Project
. Texas Medical Center
. UT Health Covid-19 Dashboard for R0 by county in Texas
Economic data that may be an early indicator on the health of the coronavirus recovery:
. Total Traveler Throughput from the Transportation Security Administration
. Apple Mobility
Page last updated: May 26, 2020 at 9:00am
